A colorful digital graphic displaying stock market analysis information in multiple languages and formats, with a blurred cityscape and stock data in the background, including a tablet screen showing financial charts and indicators.

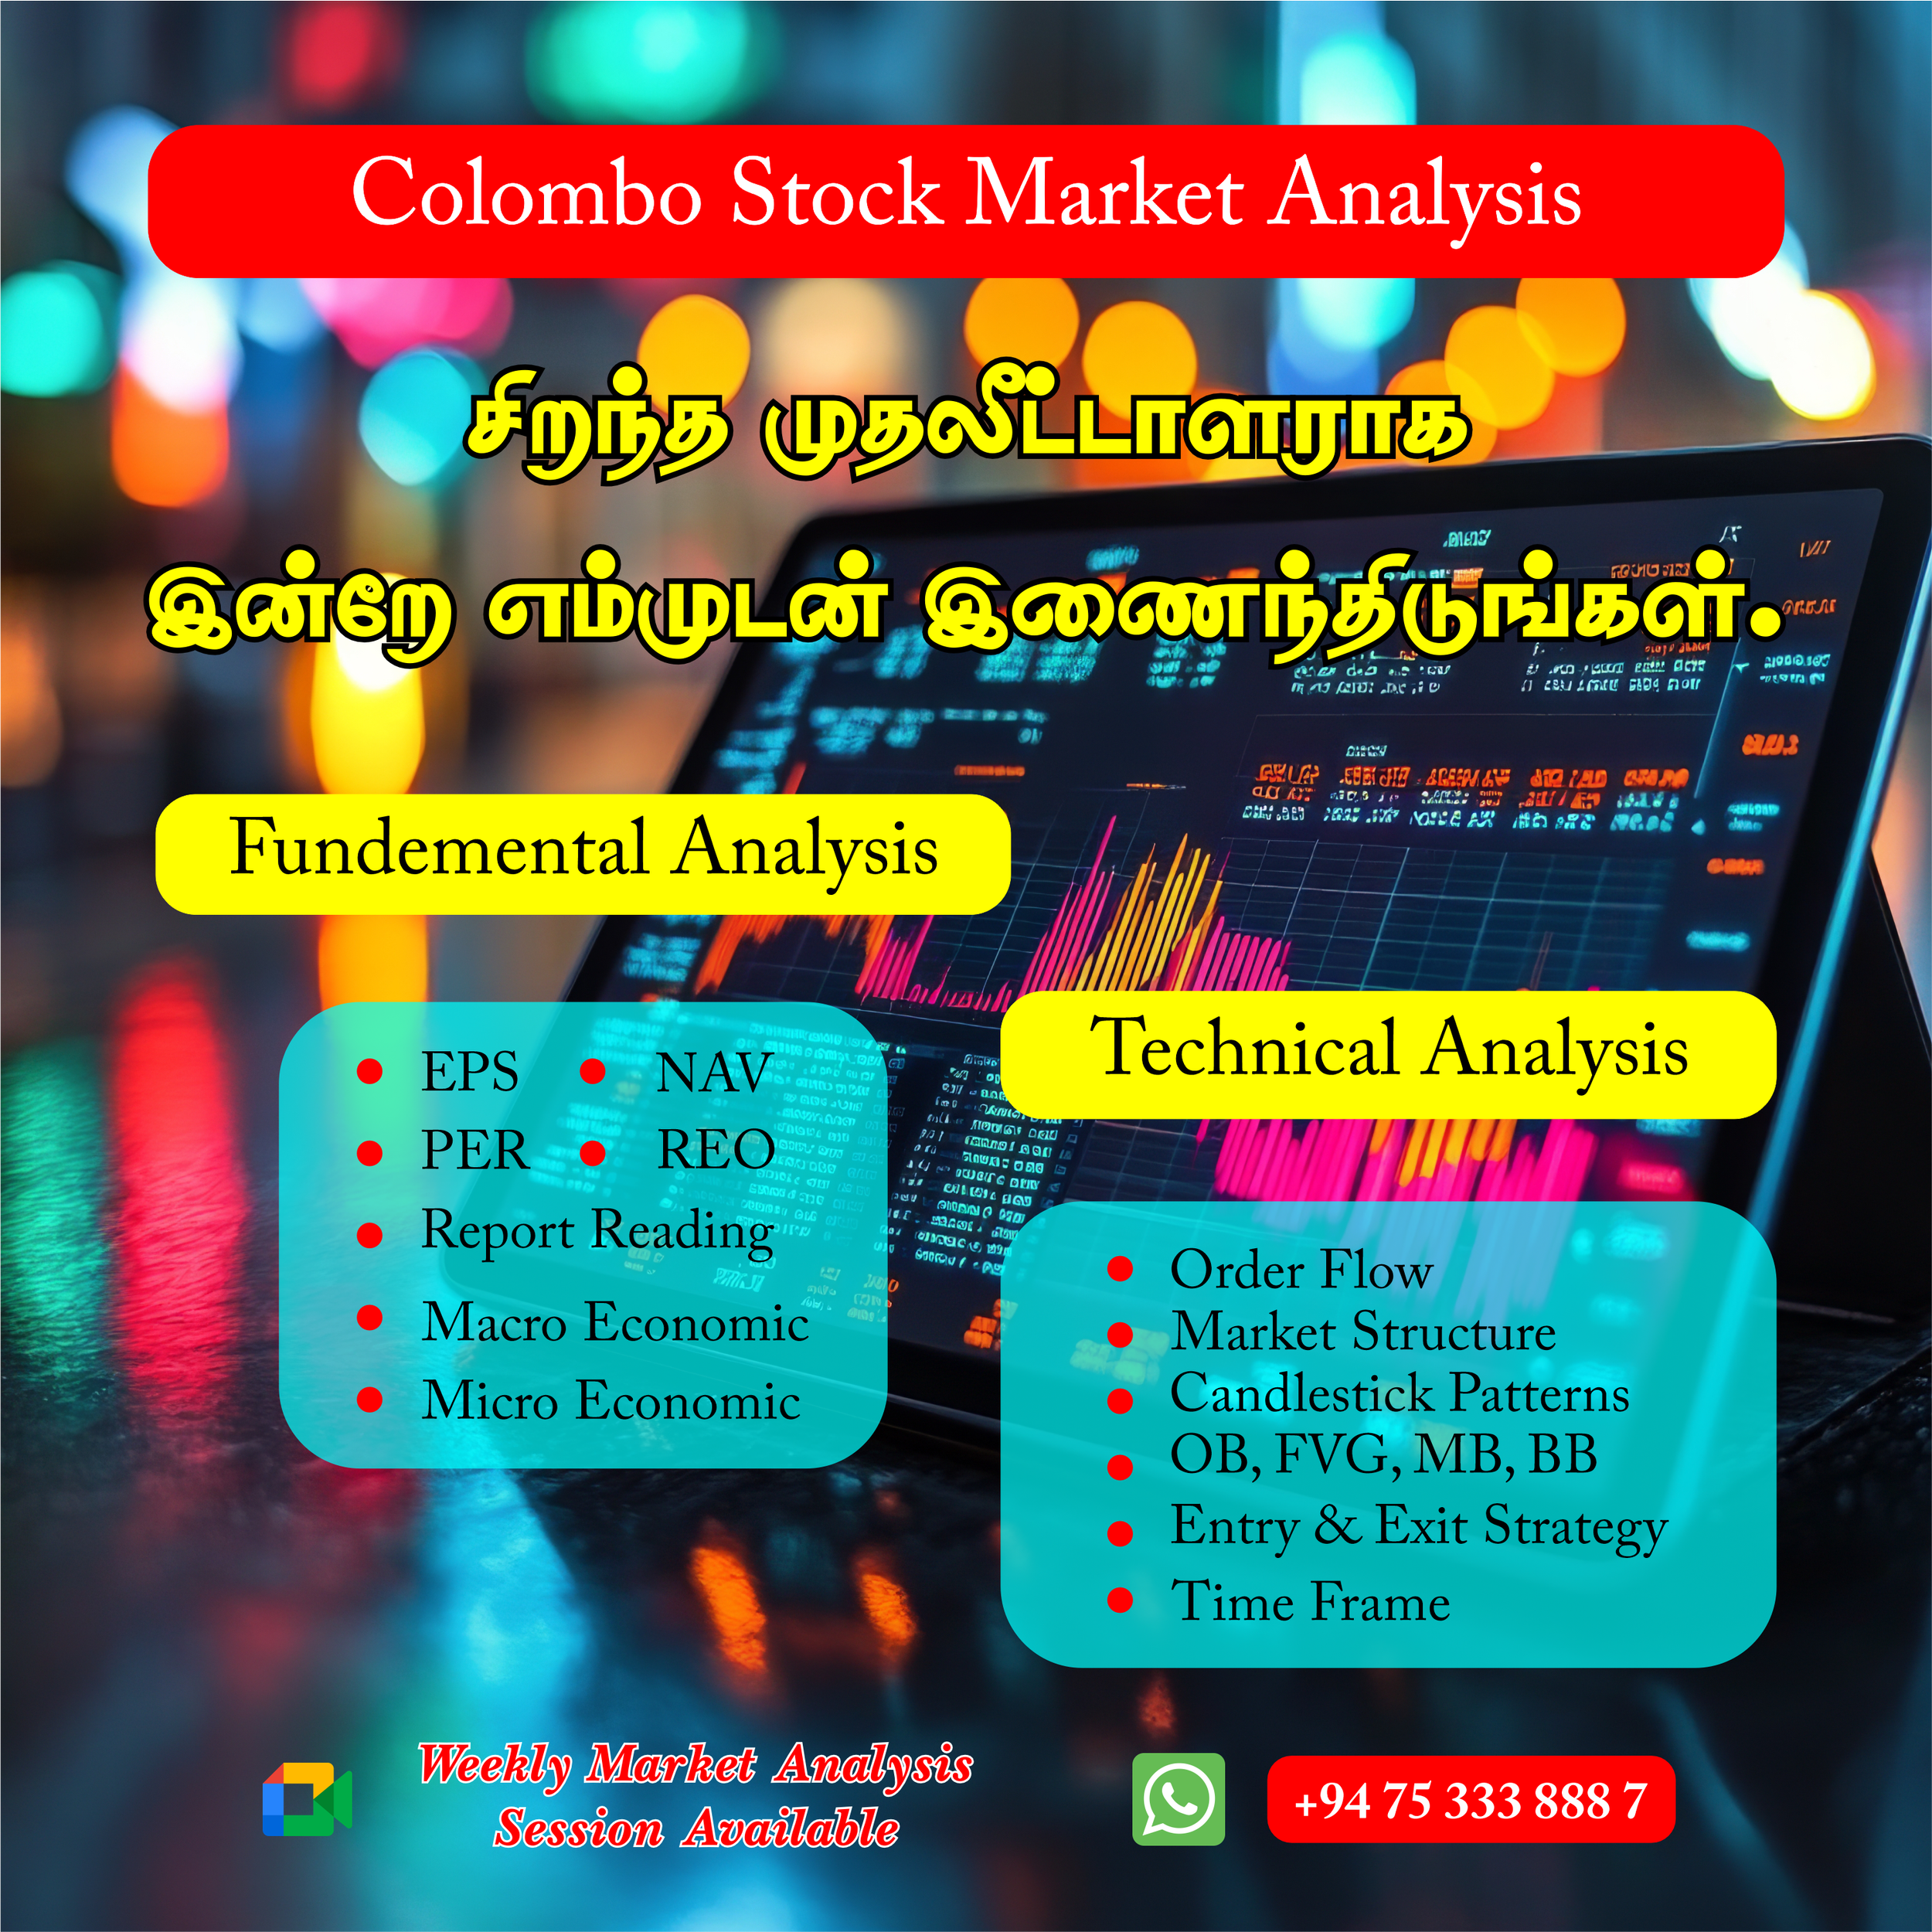
சிறந்த முதலீட்டாளராக இன்றே எம்முடன் இணையுங்கள்.

இலங்கை பங்குச்சந்தையில் உள்ள கம்பெனிகளை ஆய்வு செய்ய தேவையான Fundamental மற்றும் Technical Analysis பயிற்சிகளை ஒரே இடத்தில் பெற்றுக்கொள்ளுங்கள்.

நாங்கள் கற்பிப்பவை:

01. Market Structure & Order Flow

02. Smart Money Concepts (OB, FVG, BB)

03. EPS, NAV & Macro Economics

04. Entry & Exit Strategies

மேலதிக விபரங்களுக்கு வாட்ஸ்அபில் தொடர்பு கொள்ளுங்கள்

+94 75 333 888 7

Line graph showing the consumer price index from 1961 to 1986, highlighting three waves of inflation from 1965-1982, comparing the great inflation cycle to the current regime, with specific annotations indicating 'You Are Here' around 1971.
Bar chart showing change in global electricity generation by source from 2024 to 2025. Solar increases by 636 TWh, wind by 204 TWh, nuclear by 34 TWh, other renewables by 9 TWh. Gas increases by 38 TWh, oil decreases by 12 TWh, coal decreases by 67 TWh. Fossil fuel consumption for electricity declines despite a small total gas increase.
A man in a gray suit holding a tablet with the number 3 standing in front of a large screen displaying investment opportunities in Sri Lanka. The screen features a colorful infographic with sectors like Urban Development, Manufacturing, Tourism, Logistics, ICT, Pharmaceuticals & EV, Renewable Energy, and Agro-Processing, each with investment figures. Five people, four women and one man, are seated on the stage clapping.

Contact Us